

Persona Building for Activision, Blizzard, & King Employees
Executive Summary
In 2019, Blizzard’s Corporate Applications team was tasked with creating a help desk that could serve Activision, Blizzard, and King. As that point, the three business units had wildly different service standards and expectations. Although our team had surface level understanding of Blizzard’s internal service needs, we had no understanding of Activision’s or King’s needs. For this reason we knew that discovery work was essential if we were going to build a help desk that adequately served all three business units. By triangulating information gathered through other generative studies, such as interviews and card sorts, as well as new information gathered about users motivations and pain points, five main types of users emerged as our new ABK service desk personas.
Purpose
Personas support user-centered design throughout a project's life cycle by making characteristics of key user segments more salient. When personas are created thoughtfully, they help teams to understand the nuance that exists within their users. Although our team had created proto-personas for this product, they only covered Blizzard employees and were based on assumptions and anecdotal evidence. As Activision Blizzard moved to consolidate internal services, we had the unique opportunity to explore the needs, motivations, and pain points of each of the three business units and amend our existing personas by stripping the bias away.
Definition & Rationale
Nielsen Norman describes a persona as “a fictional, yet realistic, description of a typical or target user of the product…an archetype instead of an actual living human, but…described as if they were real people”. The goal of this project is to create descriptions that are thorough, including details about the persona's needs, concerns, and goals, leaving out background information such as age, gender, and occupation. Prominent UX practitioners such as Indi Young and Amber Westerholm-Smyth argue that personas including unnecessarily specific details or that are templatized, create bias and assumptions actually inhibit product teams. They argue that instead of developing an understanding of the thinking style the persona is representing, product teams fall into the trap of stereotyping their users based on demographic information.
They continue to argue that goal of a persona project should be to focus on behaviors, motivations, and thinking styles, which will in turn help us develop empathy for an archetype of a user we are designing for. Through this process, product teams can then begin to break away from the habit of trying to design for everyone and anticipate what the most prominent thinking styles will need from the product. Said in another way, these personas will not document every aspect of the imaginary individual's life, but rather will focus on those characteristics that impact what is being designed.
Research Question
What are the most important types of service desk users to design for across Activision, Blizzard, and King?
Methodology
This project occurred in three steps:
First, existing information was reviewed through internal interviews with members of the design team who had either worked with the project in the past or were very familiar with the project.
Once an understanding was obtained through interviews, relevant documents were audited and consolidated.
From this information, it was determined that we needed to collect data to understand behaviors, motivations, and frustrations. These data were gathered by surveying a representative group of employees from all three companies.
Participants
With our existing understanding of who are main users were, we recruited a representative sample (N = 26):
Top requestor (defined as someone who submits multiple service requests per month, regardless of role)
Low requestor (defined as someone who submits a service request ~every 6 months, regardless of role)
New hire (defined as someone who has been with the company for 5 months or less, regardless of role)
Executive assistant (recruited based on role)
Approver (defined as someone who is in the position to approve requests)
Fulfiller (defined as someone who fulfills service requests made by employees)
Study Execution
Step 1. Collect and consolidate the data.
First, existing information was reviewed through internal interviews with members of the design team who had either worked with the project in the past or were very familiar with the project. From this information, it was determined that we needed to collect data to understand behaviors, motivations, and frustrations.
These data were gathered by surveying employees from all three companies.
All card sort sessions and interviews related to previous service desk research were also reviewed and notes were taken on relevant information.
Data gathered from all sources were uploaded into Dovetail and transcribed verbatim.
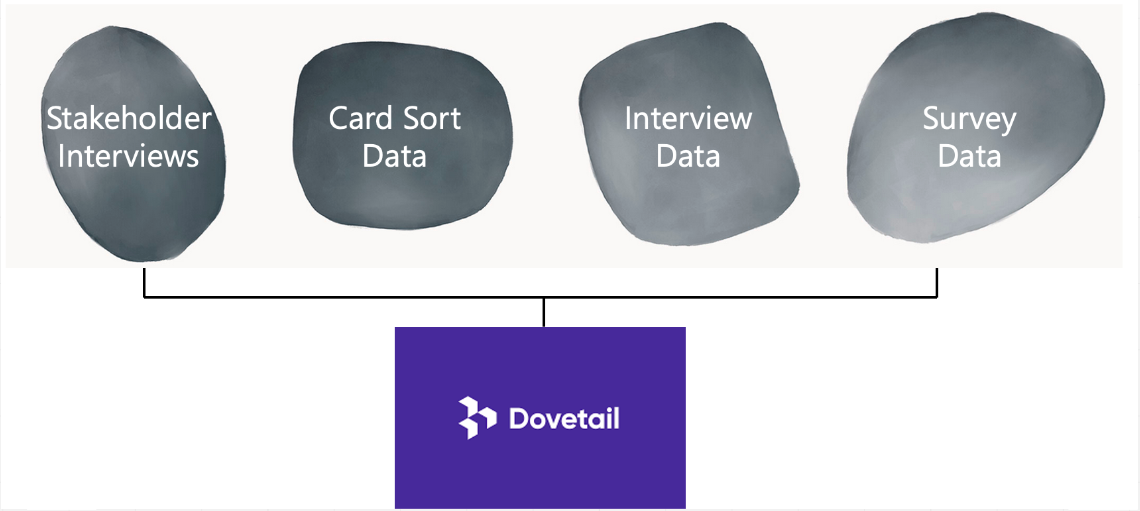
Consolidation of what we already know about our users
Step 2. Creating the Codebook
The data were then read through carefully and themes that emerged were labeled and added to a codebook. Each code received a label, a description, and an example from the raw data. The codebook acted as a map to help analyzed the data. In future research, an example of what would be considered "close but not quite" should be provided to give even more clarity into where data should and should not go. This process was repeated a few times as I familiarized myself with the data, adding new codes as the patterns became clearer.
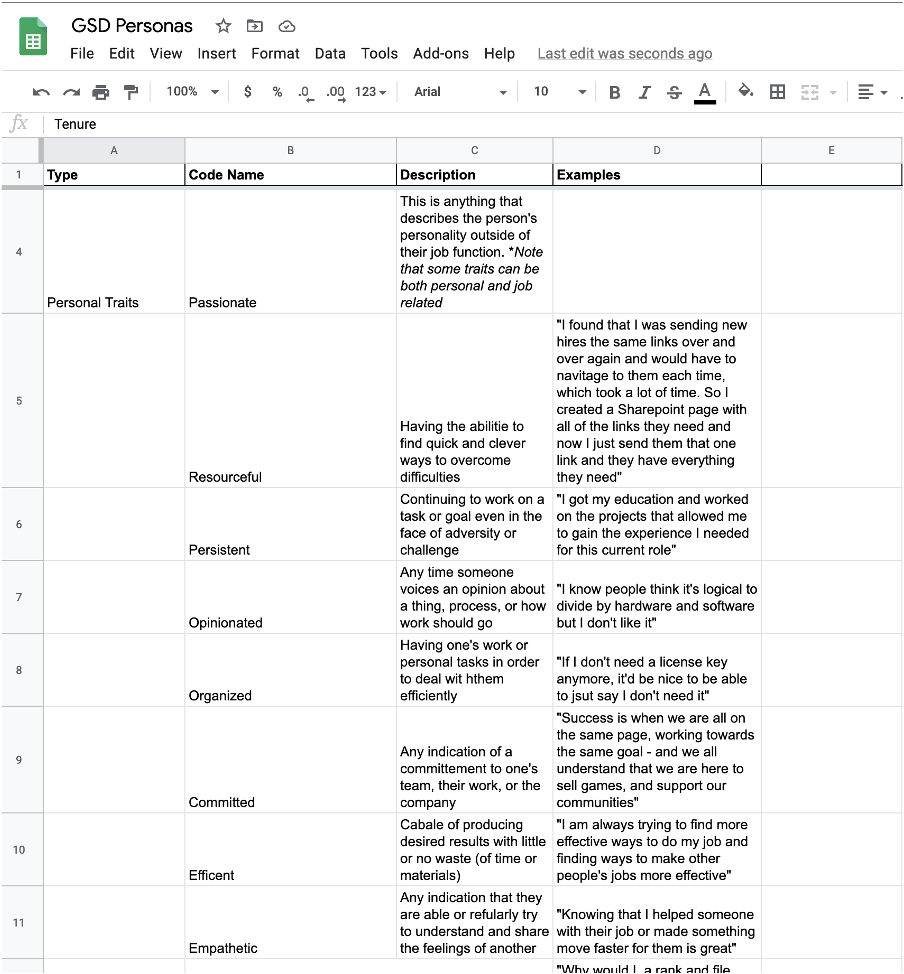
Codebook
Step 3. Coding the Data
The data were then officially coded using the program Dovetail, which allows you to attribute tags to your data. Ideally this process is done with multiple people in order to establish inter-coder reliability, however, our resources were extremely constrained for this project so I served as the sole coder. For this reason, I took extra precautions later in the process to ensure my inherent bias did not play a prominent role in the personas. My primary objective was to allow the data to tell me what was happening, not the other way around. With each pass through of the data, more themes and sub-themes emerged. After all of the data were tagged, I then began to group the codes into tiers.
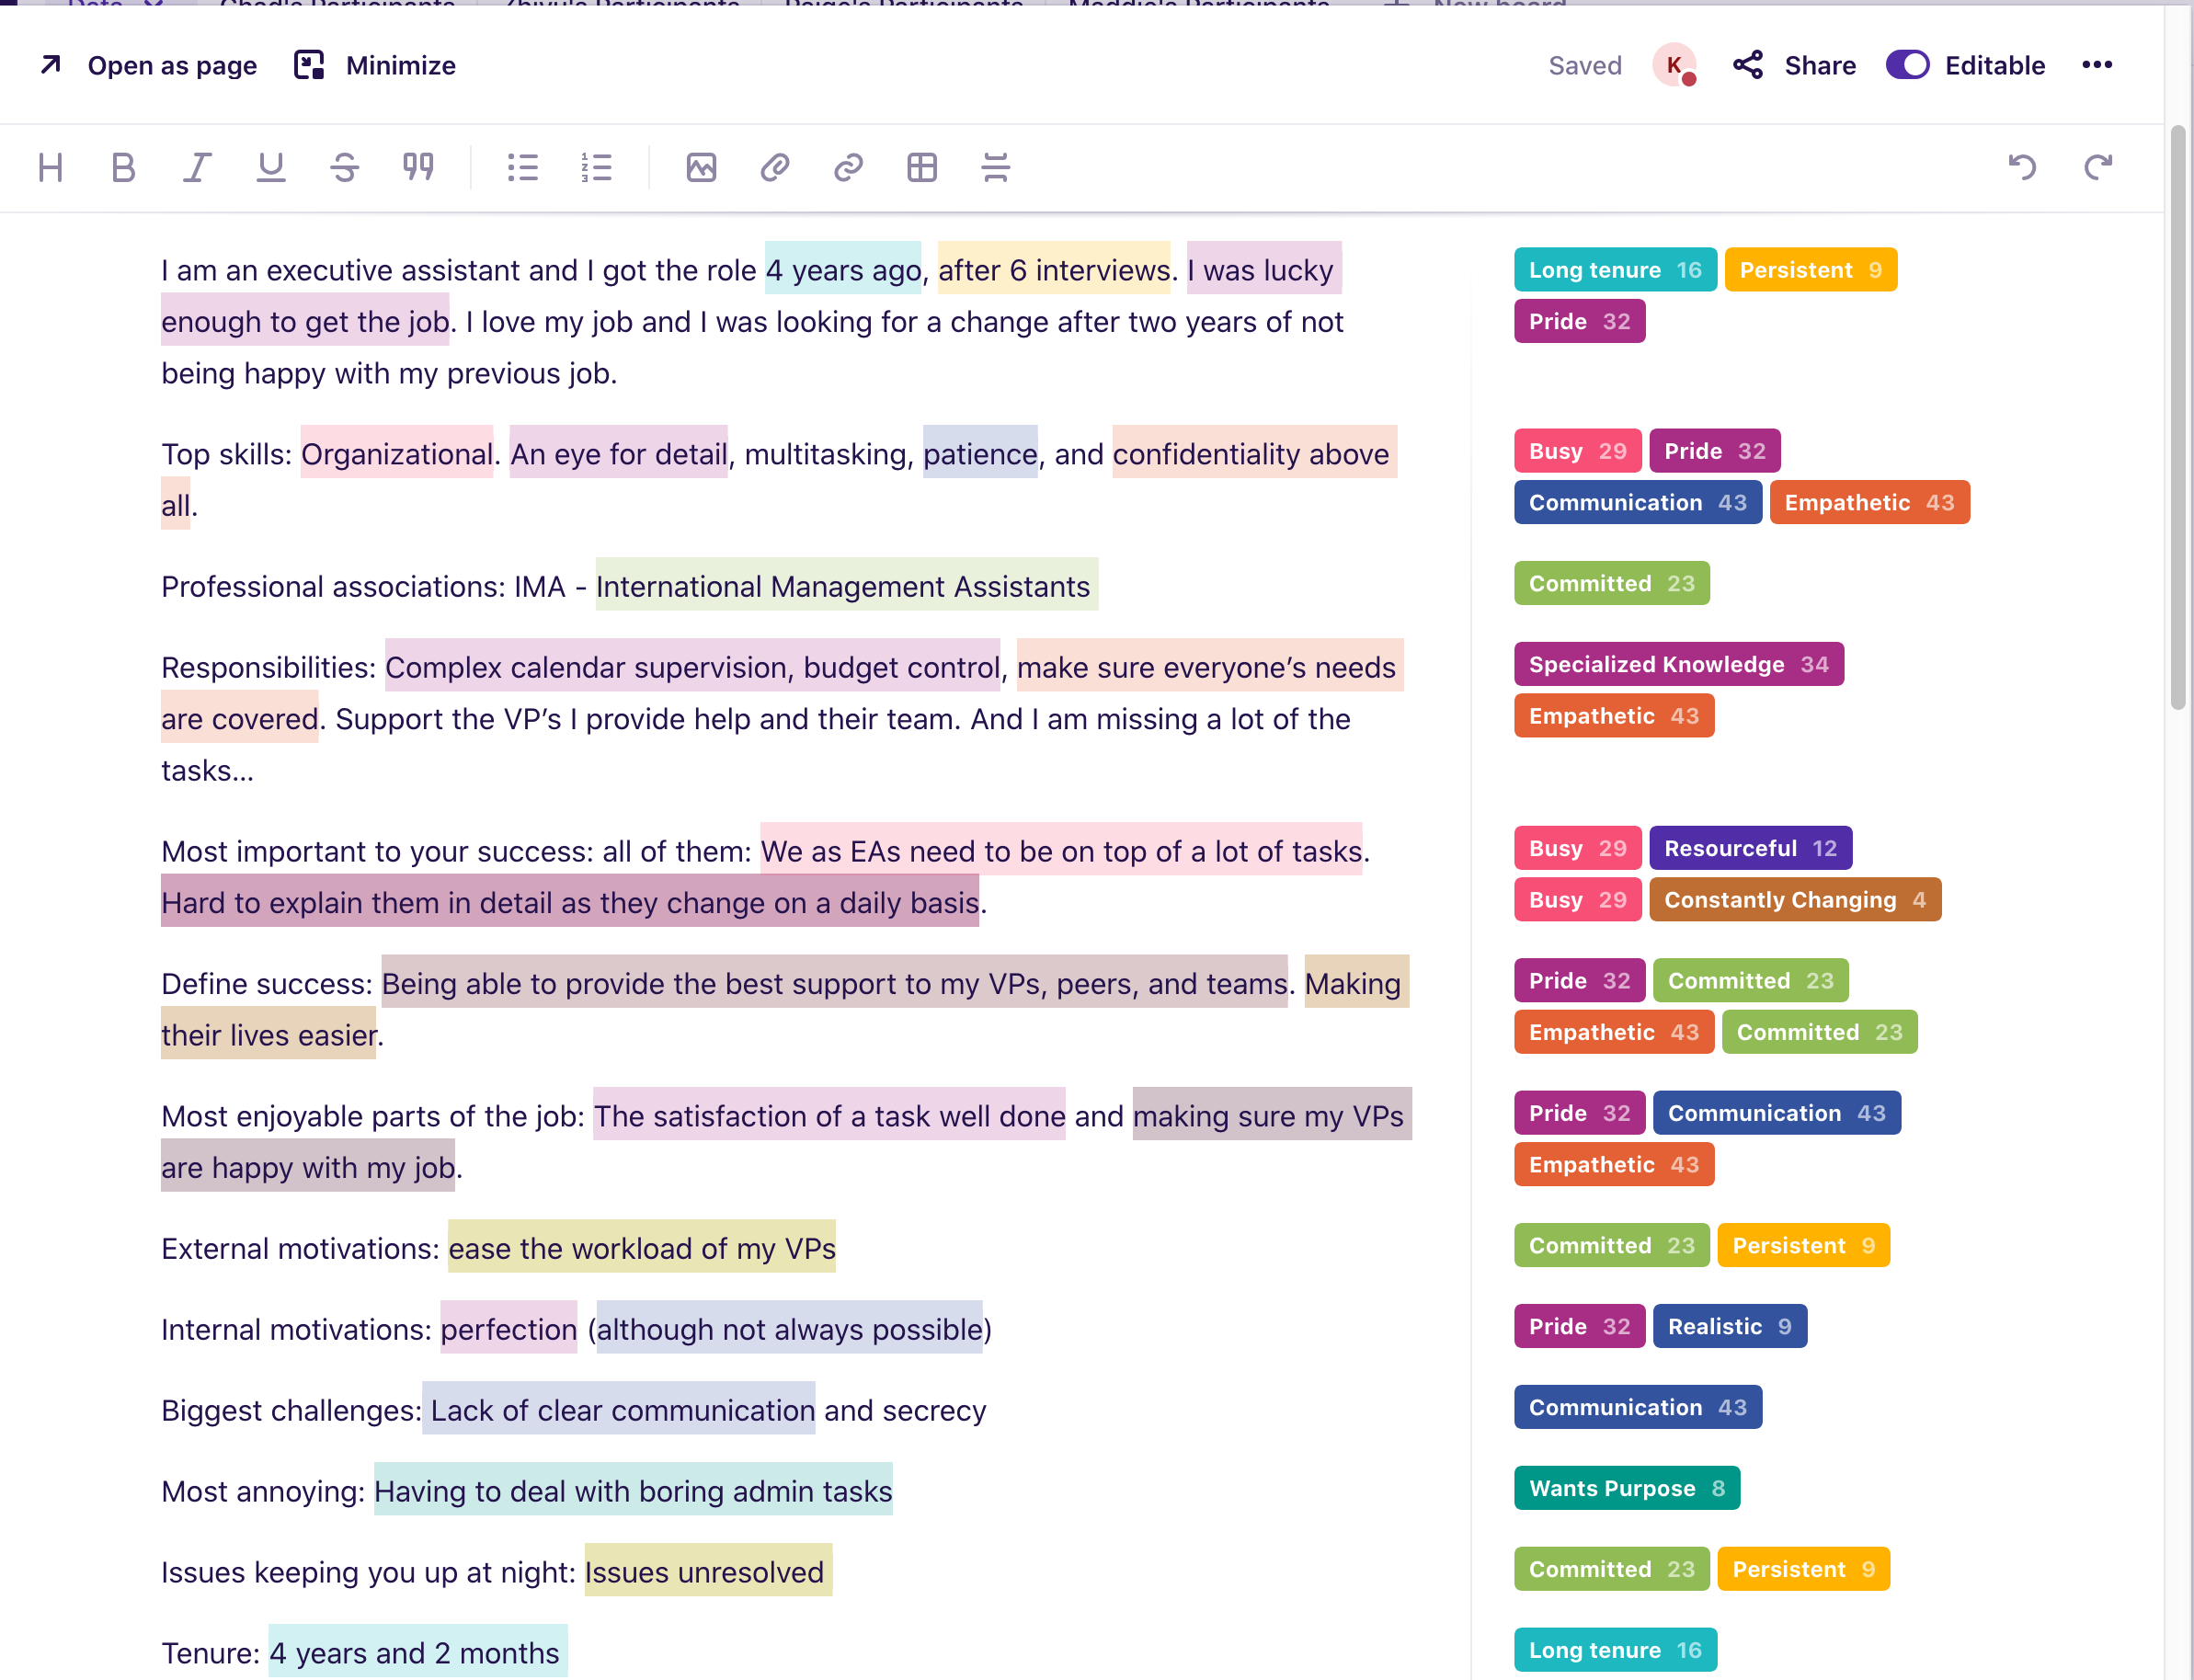
Coding the Data in Dovetail
Step 4. Mapping the data
To begin finding the patterns in the codes, the data were then moved over to Miro in order to use a technique called affinity diagramming. Each piece of coded data became its own sticky note. Sticky notes included a quote or a relevant piece of information, the relevant code attached to it, and the participant number. Different colored sticky notes were used to identify different participants. I then created a three- to five-part scale template (seen below) that was replicated for each theme that emerged. The sub-theme denoted the scale points on that theme.
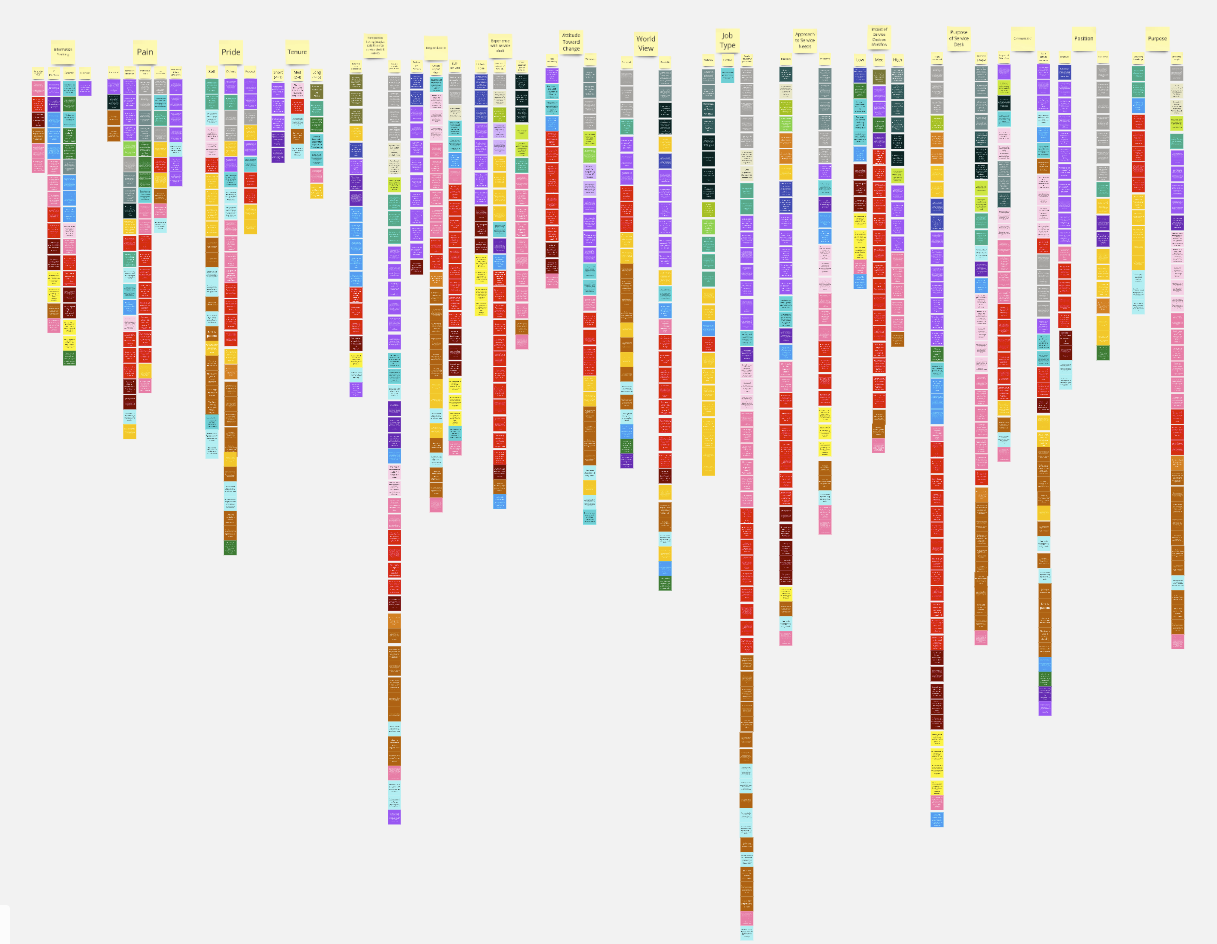
Affinity Sorting
Analyzed in Miro
Once this was complete, the themes were evaluated for matching. Did the participant have data on that sub-code? If so, their sticky note with the relevant quote would be moved to the template. By doing this, I was able to visualize which participants had similar experiences, beliefs, and attitudes within themes and across themes.

Theme Template
Analyzed in Miro
Step 5. Coloring the participants allowed me to track which clusters of participants shared the same response across themes but with this much data, it was still difficult to evaluate these just by eyeballing it. To solve this, the data were moved into Excel to determine the exact number of people who fit into each category. To do this, an algorithm was used to calculate how many people shared the same responses with one another. I started with 5 shared responses as the lowest commonality and conditionally colored the sections. This in essence told us the persona group size and what the common data points are.
Conditionally colored data to highlight which clusters of participants shared the same responses.
*5-7 were colored yellow, 8-10 were colored orange, 11-13 were colored red, and 14 + were colored dark red).
Persona sizes varied in number of participants they included, which was expected. The smallest group size was based off of two people (which is unusual however they stood part from the rest of the groups so obviously that it made sense for them to have a separate group) and the highest was based off of 12 people (with people able to be in more than one group). In this way, we are able to account for people changing between different thought patterns.
Step 6. Findings: Bringing a Narrative to the data.
With the knowledge of who responded similarly, we then gave a story to each of the groups. The goal was that no matter where someone decided to delve into the personas, they would be able to take away a consistent idea of what that persona was all about. Each persona included a descriptive name and tag line, a notable quote from the data, a narrative, and “snackable” insights for quick glance. This way, any type of learner should feel that these personas are accessible and not alienated by the type of template they may have seen before.
Step 7. Socialization & Distribution
Once all five of our personas were complete, they were distributed to our stakeholders. Because this group was a little more diverse and had varying levels of experience with our service desk, our team determined that the most effective way to socialize our new personas was to create a game. The entire department was invited to a presentation called “Persona Speed Dating”. Participants were divided between the five personas and sent to breakout rooms where they were told to familiarize themselves with the characteristics of their assigned persona. They were then split up and sent to another breakout room containing the other four personas. Then each group was given a task to complete in the service desk, such as needing to request a new piece of hardware, and discuss how they would approach this task and what would be important to them from the perspective of their persona. This allowed them to focus on one persona, instead of all five, while still learning about all five from their colleagues. After the speed dating was over, participants commented that it had been one of their favorite meetings they have ever been to. Those who participated in the game also started trying to identify which persona they most identified with, showing early signs of empathy building for our users.
A more formal and informational presentation was given to our project leaders at Activision and King.